
What building Insightify taught me about probabilities
Calibrating many sources of probability over time can make predictions steadily more honest, and the record itself becomes content worth reading.

Drinking from a firehose of forecasts
I worked in fintech for over twenty years, five of them in crypto, and I have been studying the markets for over three decades. Following markets today feels like drinking from a firehose. Everyone has an opinion, and many opinions arrive with a number attached: a 70% chance of a rate cut, an 80% chance that bitcoin breaks out.
Those numbers come from very different places: a prediction market, a hedge fund's data model, an AI, a key opinion leader's social post. They can all sound equally sure of themselves. What I rarely saw was the comparison that would let me judge the number: when that source had said 70% before, had those things happened about 70% of the time? The question I could not stop asking was simple: when a source says "70%", what should I believe?
That question led me to build Insightify, which is becoming Preponder·AI. It is a market analysis and content engine: every night it reads the market, makes its own dated forecasts, grades the ones that come due, studies its misses, learns which sources and patterns deserve trust, and turns the record itself into articles. This note reports what the first months of that experiment taught us about probabilities.
Probabilities come from three places, and each is judged differently
A probability is a number between 0% and 100% attached to something that has not happened yet. At least three common sources supply one, and each comes with its own way of deciding whether to trust it.
Prediction markets. A prediction market sells contracts that pay $1 if an event happens. If such a contract trades at $0.64, the price reads as about a 64% chance (Wolfers and Zitzewitz, 2004). The number comes from what traders are willing to pay. Markets are usually judged by liquidity, meaning how easily contracts trade, and by who is trading. Polymarket, for example, publishes a self-reported accuracy page with a Brier score of about 0.06 for prices one month before resolution. The Brier score is defined below.
Professionals and experts. An economist, an analyst or a commentator offers a probability, or a view that can be turned into one, based on judgment. These sources are usually judged by credentials and fame, which say little about how their past probabilities turned out. In Philip Tetlock's twenty-year study of 284 experts, the better known and more often quoted the expert, the less accurate they were (Menand, 2005). Attention is not accuracy.
Engines, models and math. Statistical models, machine learning systems, pattern libraries and weather ensembles all output probabilities. They are usually judged by backtests, which replay the model on past data, and by fit, meaning how well it describes that data. A sentiment gauge such as CNN's Fear & Greed Index, which rates the market from extreme fear to extreme greed, is an input of this kind. It becomes a probability only when its history is tied to what happened next.
The three sources differ in how the number is made and in how it is vouched for. Figure 1 places them side by side and adds a fourth element that is not a source at all. Look for the band that runs underneath all three.
Calibration is a test and a correction, not a fourth source
The band in Figure 1 is calibration. It does not compete with markets, experts or models. Any of them can take the check, and any of them can receive the correction afterwards.
Calibration means the probabilities stated match how often such forecasts come true. Here is an illustration. A forecaster announces an 80% chance of rain every day, and over a year it rains on 14% of the days. Across the year, the forecaster is clearly overconfident, and the size of the error can be measured.
Figure 2 draws that example. The gap between the stated 80% and the realized 14% is 66 points, and that gap is the thing to look at.
The test asks one question: do the 70% forecasts come true about 70% of the time? It ignores credentials, fame, liquidity and method, and judges only the record of stated probabilities against outcomes. That is what makes it unusual. A market, an expert and a model can all be audited by it, and none of them can pass on reputation.
Calibration is not the whole of forecast quality, though. A forecaster who says 50% about everything is perfectly calibrated when half the events happen, but those probabilities do not distinguish which events are more likely. The missing quality is resolution, also called sharpness: how decisive and discriminating the forecasts are. A useful forecast must distinguish events with different chances of happening, while keeping those chances consistent with outcomes. Good probabilistic forecasting aims to maximise sharpness subject to calibration (Gneiting, Balabdaoui and Raftery, 2007). In plain terms, be as decisive as the record supports and no more.
The Brier score (Brier, 1950) puts both qualities into one number. The score is the average squared gap between the probability given and what happened. Zero is perfect, and saying 50% to everything scores 0.25. Saying 90% about something that does not happen costs 0.81, while saying 60% costs 0.36, so overconfidence is expensive. Murphy (1973) showed that the score splits into reliability (calibration), resolution and uncertainty. Because the pieces are separate, calibration can improve while skill stays flat.
A system can become more honest about its probabilities before it becomes better at distinguishing outcomes.
That separation is what Insightify's early data made visible, and the experiment is described next.
The experiment: a system that makes forecasts, grades them and marks itself down
Insightify is a market analysis and content engine. It reads the market macro-down: macro first, then rates and credit, currencies, equities and sectors, commodities, and crypto, with crypto as the first proving ground. It was built to test whether patterns in markets, and in the crowd of experts who comment on them, can yield better probabilistic forecasts and at least good content. It makes its own dated forecasts, which is its primary goal and the base of its content. The prototype grades its forecasts and backtests the misses. Public grading is part of the product's method; the prototype site is not yet public.
The engine runs a nightly loop, shown in Figure 3. Follow the steps in order, and note how little the AI step does.
- It reads about 57 free sources: publishers, analyst newsletters, video channels and forums, with no paid data.
- It turns stories into dated, sourced facts. The AI step only extracts and writes prose, and the rest is plain, auditable code.
- It mines patterns: what tends to follow what, and how often.
- It makes forecasts from patterns that have a measured record, each with a deadline, a probability and a rationale.
- It grades yesterday's forecasts as correct or wrong.
- It backtests the misses, re-running variants to see which signal would have worked.
- It re-weights trust in every source, expert and pattern. Patterns that stop working are retired, and the planned public record will show those retirements.
The engine applies calibration as a markdown between mining a pattern and publishing a forecast. The stated confidence on each forecast is marked down to what forecasts like it have actually achieved, so a 60% forecast that the record supports only at 45% ships as 45%. Figure 4 shows the prototype's card for a pattern that held in 93% of past setups. Compare the headline number with the published one.
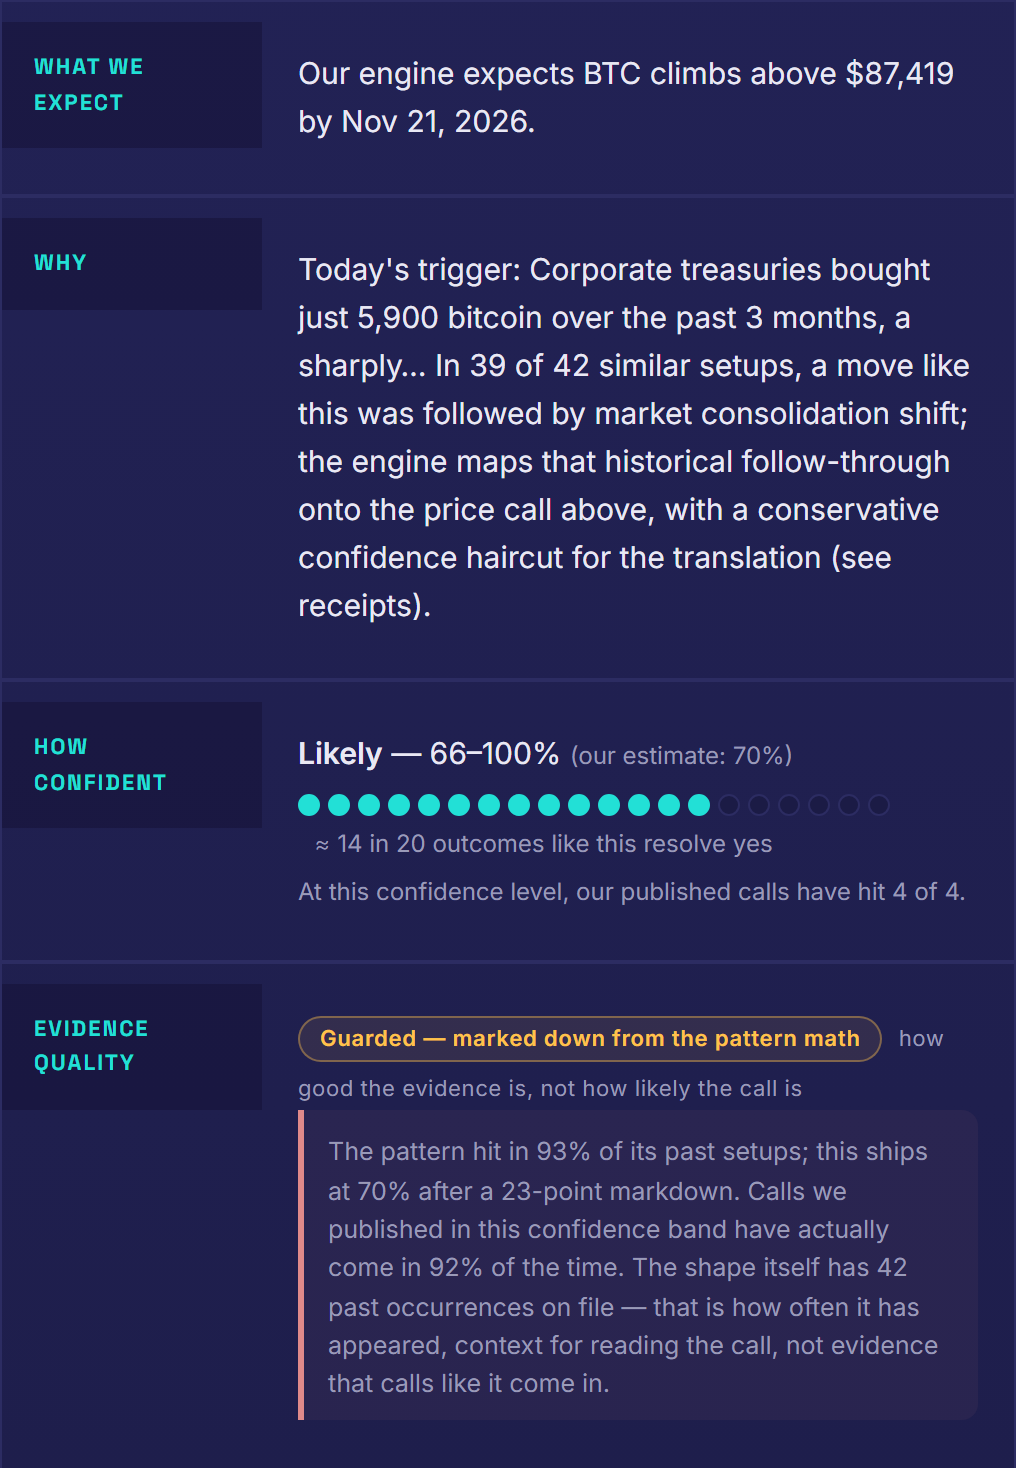
The pattern wants 93%. After a 23-point markdown the card ships at 70%, because the system publishes the number its own graded record supports.
The engine applies the same logic to people and outlets. Around 90 outlets are graded, and 43 analysts and influencers are on the scoreboard. The aim is not only to see who was right but to learn who is right, when and under what circumstances, and to calibrate that together with much more data. The engine learns trust from resolved predictions where there is enough history and seeds it where there is not, and below 6 resolved observations a score is never called earned. A thin record cannot outrank a long one: two correct forecasts out of two leave the source's weight near its starting assumption, rather than establishing 100% reliability. Thin or poor records serve as contrarian foils, never as authorities.
Insightify is also a content engine. It clusters coverage of the same story from several outlets (crowds and forums never count toward a cluster), uses Google News rank as a free demand signal, and follows the topics influential accounts are driving. Its articles cite their sources, quote named experts including a contrarian, and carry a dated, falsifiable prediction. Figure 5 shows the last run as a chain of stages, from sources to published articles.
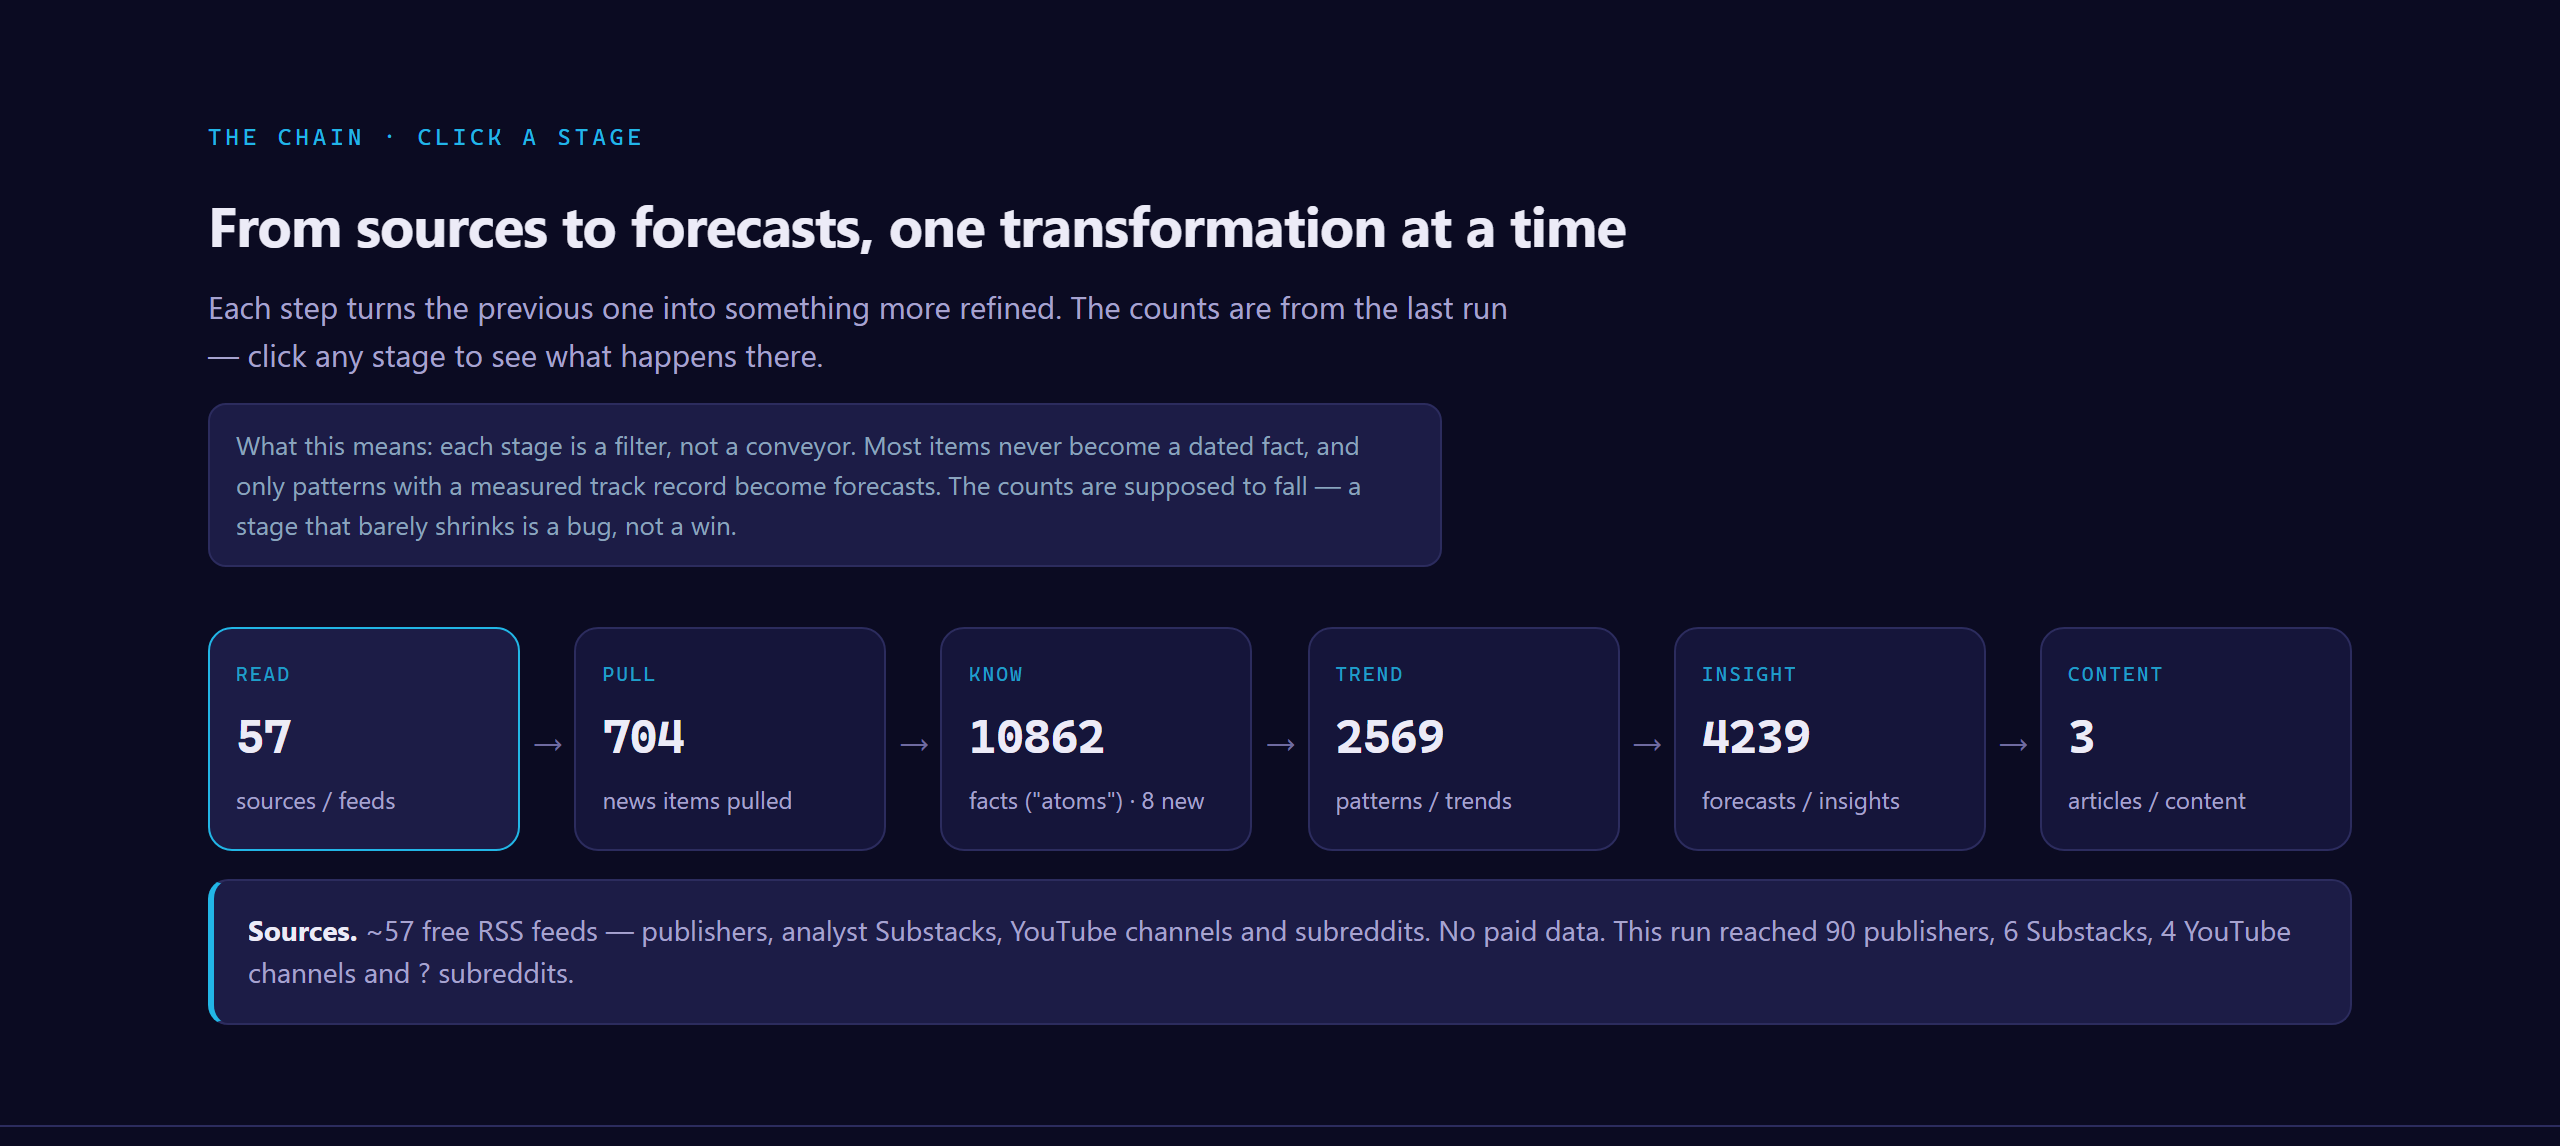
The last run's recorded chain was 57 → 704 → 10,862 facts → 2,569 patterns → 4,239 forecasts → 3 articles.
Findings: calibration improved faster than skill
The samples are small, so read everything below as early test-and-learn. Findings come first, with their sample sizes.
Finding 1: the calibration gap narrowed. On 12 July 2026, across 23 forecasts, the gap between stated and realized confidence was 23 points. On 27 September 2026, across 38 graded price forecasts, it was 10 points. The prototype now publishes statements of the form "60% → 50%", stated against realized.
Finding 2: skill ended near a coin flip. The first 38 graded price forecasts were correct 19 times and wrong 19 times. The price-forecast Brier score is about 0.26, against 0.25 for a coin flip. Figure 6 shows the calibration gap narrowing from 23 to 10 points and the reported price-forecast Brier score of about 0.26 beside the 0.25 baseline.
This matches the reliability-versus-resolution split in Murphy's decomposition, though with samples this small it is a pattern, not a proof. The markdown corrects how much the system claims. It does not by itself make the system better at telling outcomes apart. Calibration improved faster than skill. One hypothesis for the ordering is that a correction can take effect at once, while real discrimination has to be found in the data.
Finding 3: timing was the biggest effect. In a June baseline backtest, next-day forecasts scored a Brier of 0.376, which is worse than a coin flip, while two-week forecasts scored 0.145. These are backtest results, not public predictions. The supplied backtest record does not state sample sizes, so these scores cannot establish how reliable the horizon difference is. Of everything tested in the backtests, forecast horizon moved the score most. These scores should not be set beside Polymarket's self-reported 0.06, because the questions and horizons differ, and a Brier score means little without knowing what was asked and when.
What the findings suggest, and what they do not
The following are hypotheses, not findings.
Hypothesis 1: pattern history overstates confidence. A pattern that held in 93% of past setups was found by searching the past. One hypothesis is that searching past setups selected patterns whose apparent confidence will not hold in future forecasts. If so, the markdown is not cosmetic. It is where a pattern's history meets the record of forecasts actually graded. The 93% to 70% card is consistent with this idea, but one card does not establish it.
Hypothesis 2: thin records cannot be trusted, so weighting needs history. A source that has been correct twice has not yet shown it is reliable, which is the reasoning behind the 6-observation floor and the pull toward the starting assumption. The floor is a design choice, and whether 6 is the right number is untested.
A house rule guards against overreading all of this: a number may be published as an accuracy claim only if the forecasts behind it could have produced a worse one. A pattern that cannot lose teaches us nothing.
The prototype, and the name that had to change
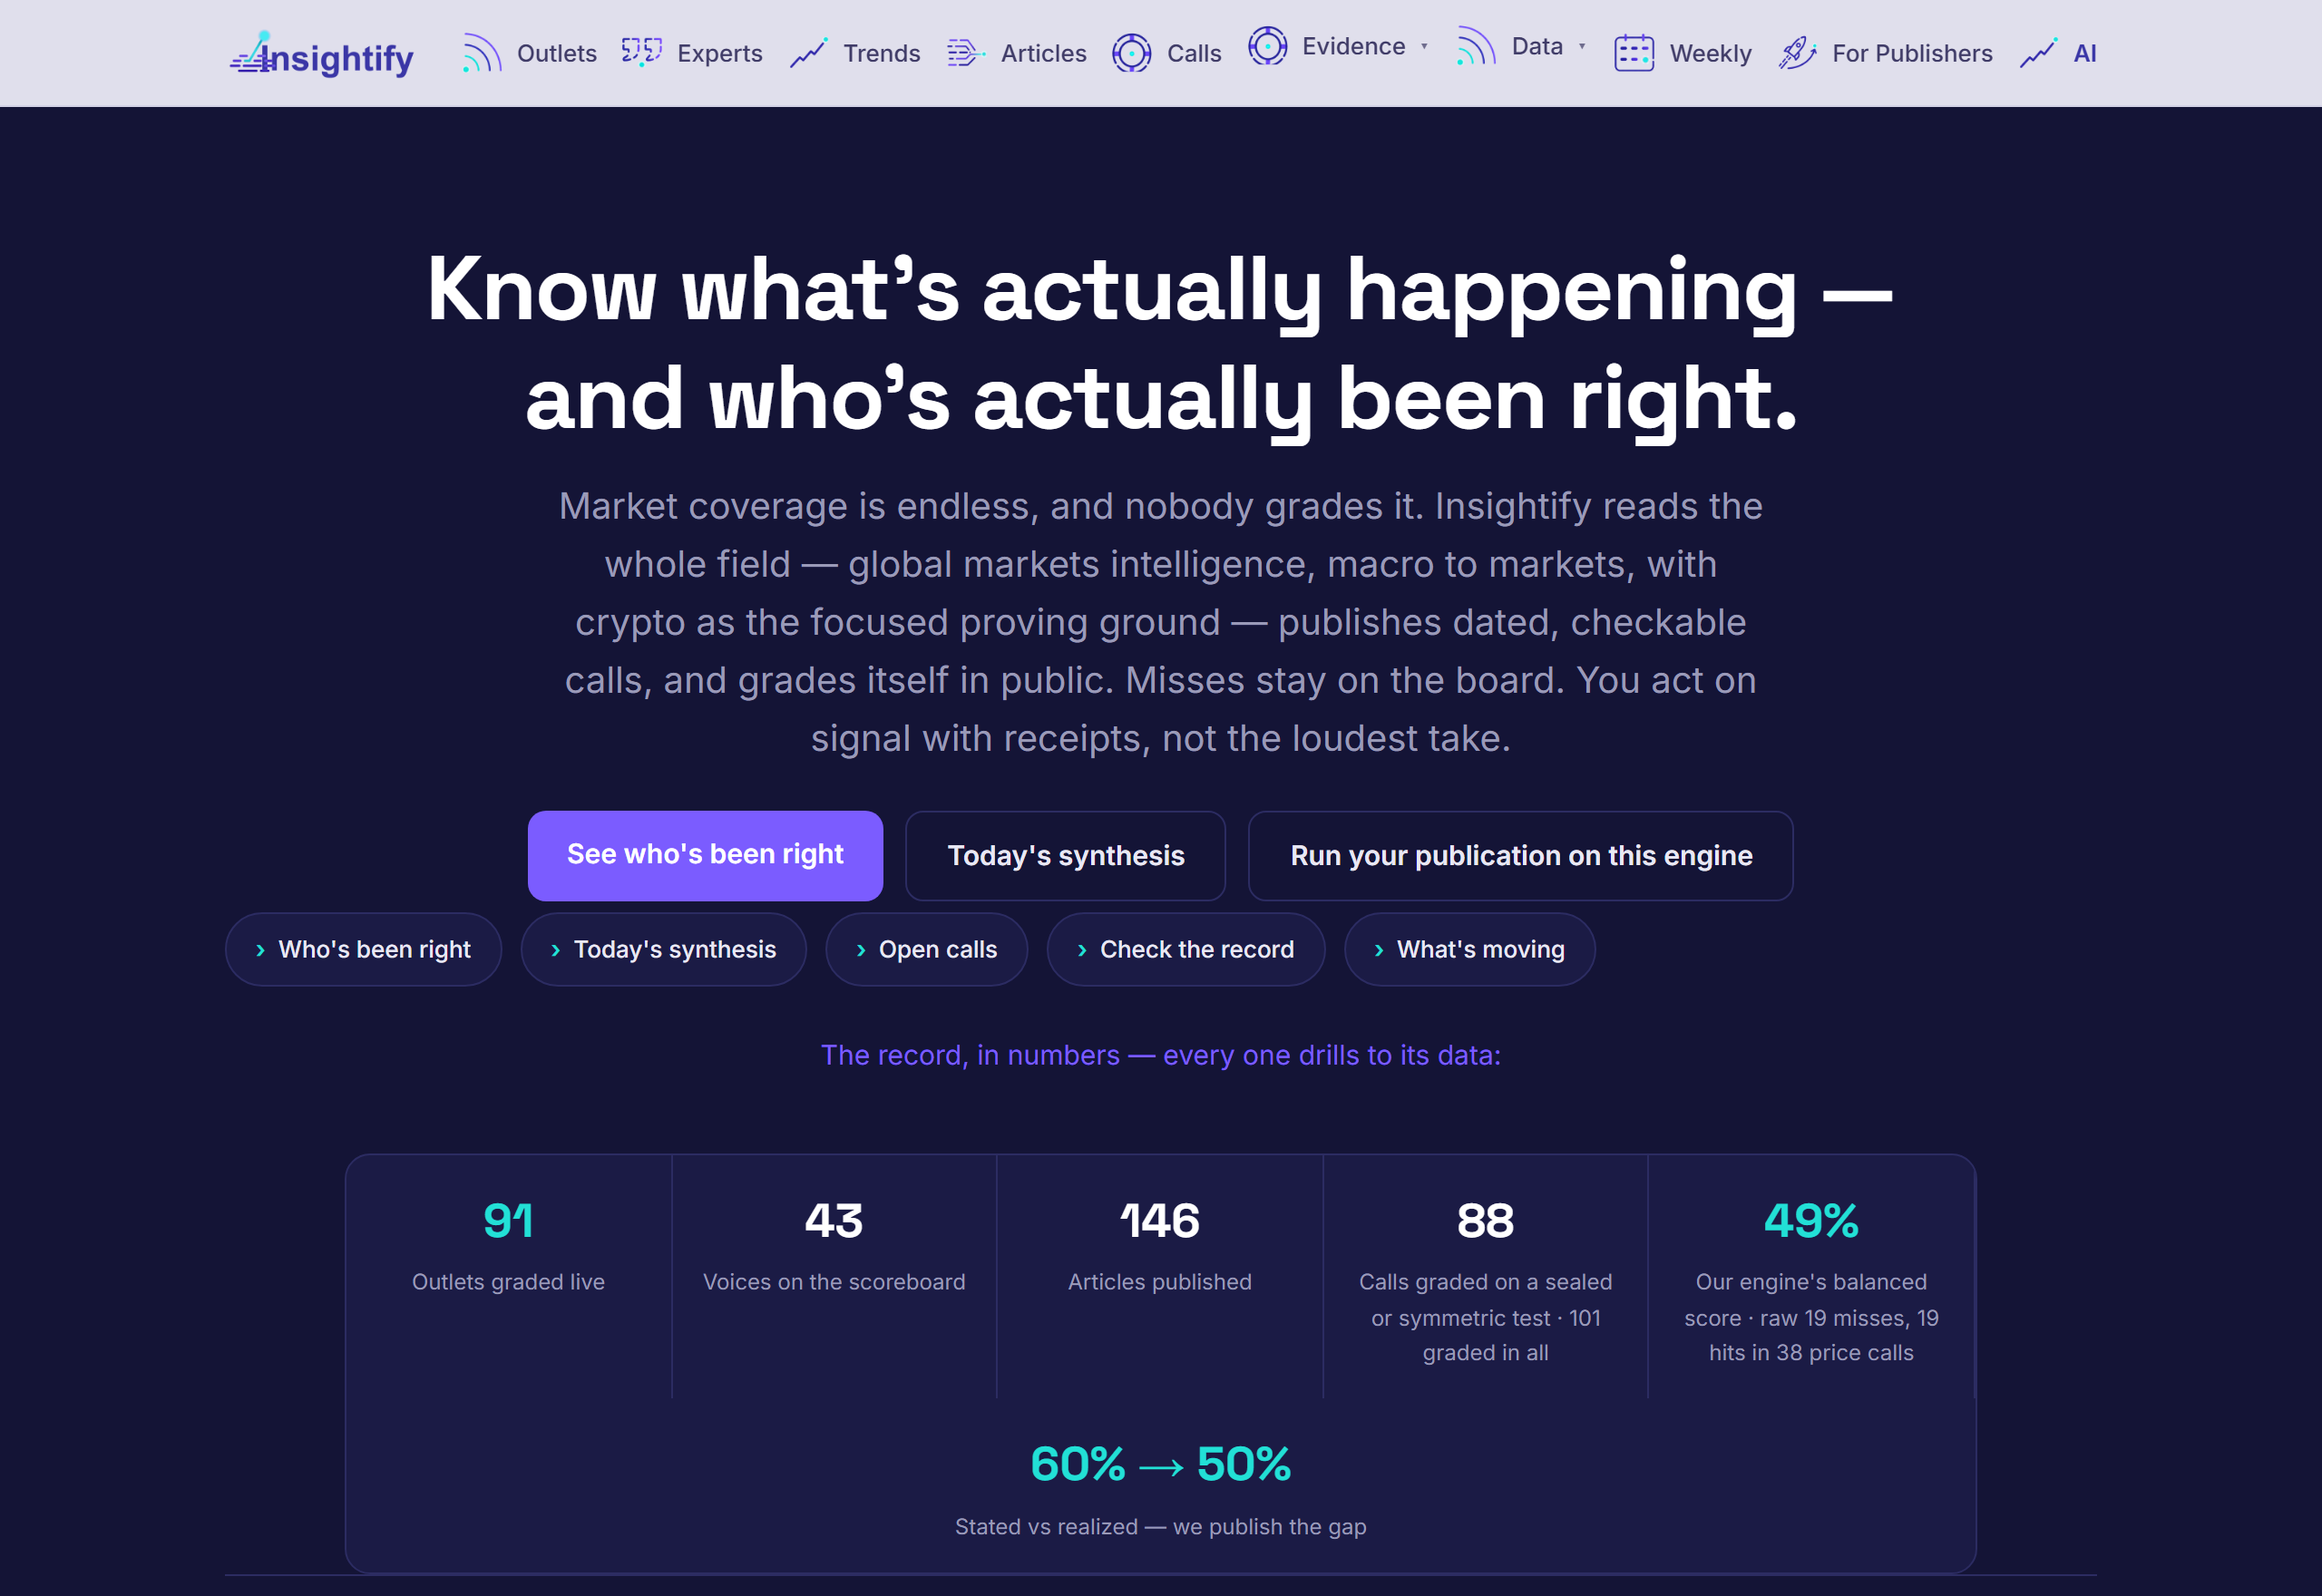
Figure 7 shows the prototype's home-page design. It leads with "Know what's actually happening, and who's actually been right" and publishes the gap between stated and realized confidence ("60% → 50%"). The project's positioning lines put the method in brief: "Every prediction dated. Every miss published."
Insightify was the preferred name, but several analytics companies already trade under it, for example Insightify Analytics and Insightify BIZ on the Microsoft marketplace, so the name could not be claimed. After 1,815 candidates, Preponder was chosen and locked on 7 August 2026. To preponder is to outweigh, and "preponderance of the evidence" is the standard for "more likely true than not", which is the claim a calibrated forecast makes. The preponder.ai domain was open, and a trademark knockout search in the US and Canada came back clear. The mark, Perspective frames (three receding frames), was locked on 27 August 2026. Figure 8 shows the old and new identities as a pair.


Open questions for the series
The early data raises questions this note cannot answer. With 38 graded price forecasts, a Brier score of 0.26 is hard to tell from 0.25, so the first question is whether skill will follow calibration as the sample grows or whether the pattern library is short of real signal. The second is how markets, experts and models should be calibrated together, and when one source's record deserves to override another's. The third is which circumstances carry information about who is right, and which are noise. The fourth is where the horizon effect comes from: the markets, the patterns or the grading. Last is the cost of honesty. Publishing 70% instead of 93% is more candid, but whether it makes content less compelling, and whether readers reward the candor, is untested.
- Justin Wolfers and Eric Zitzewitz, "Prediction Markets", Journal of Economic Perspectives, 2004
- Polymarket, accuracy (self-reported)
- Glenn W. Brier, "Verification of Forecasts Expressed in Terms of Probability", Monthly Weather Review, 1950
- Allan H. Murphy, "A New Vector Partition of the Probability Score", Journal of Applied Meteorology, 1973
- Tilmann Gneiting, Fadoua Balabdaoui and Adrian E. Raftery, "Probabilistic forecasts, calibration and sharpness", Journal of the Royal Statistical Society: Series B, 2007
- CNN, Fear & Greed Index
- Louis Menand, "Everybody's an Expert", The New Yorker, 2005
- Insightify Analytics
- Insightify BIZ, Microsoft marketplace